01
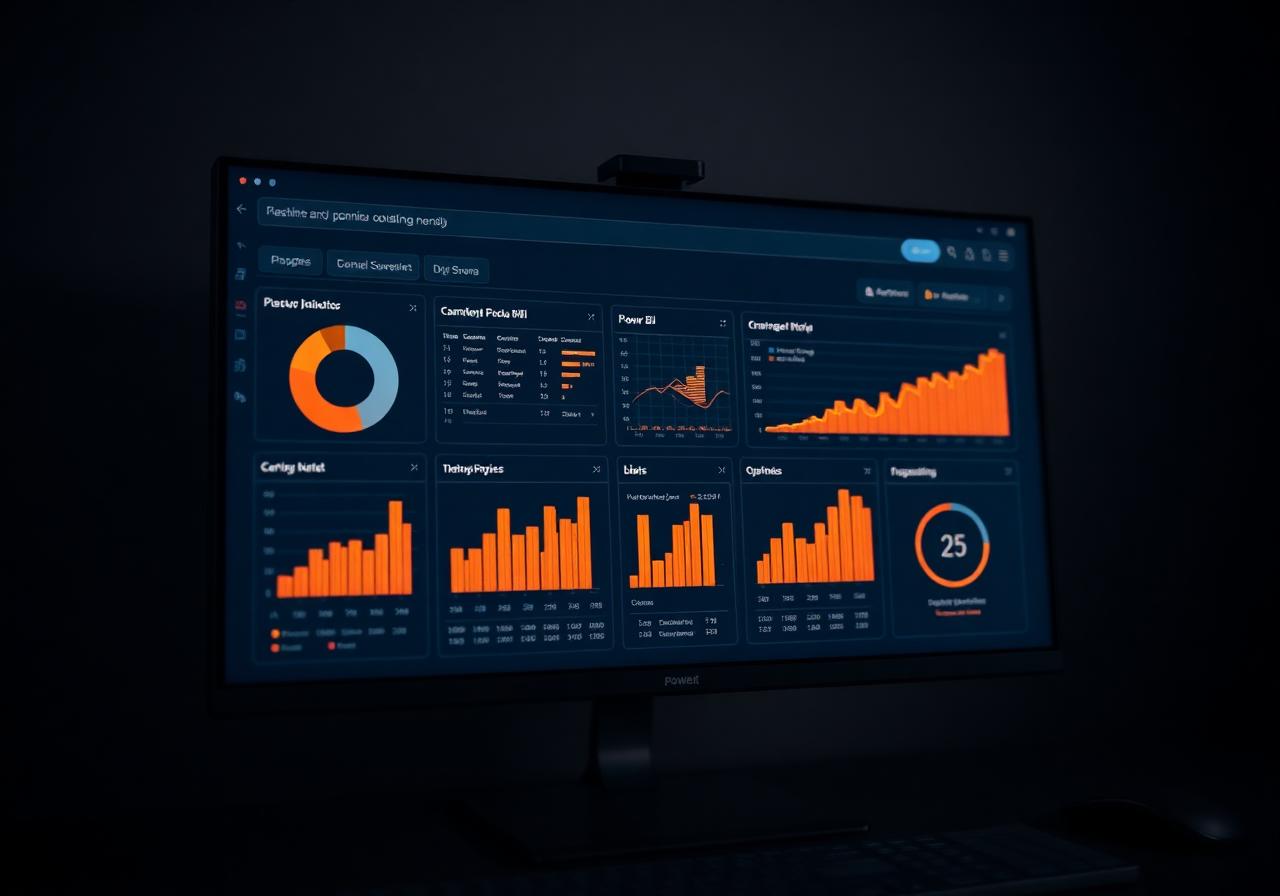
Power BI
BI & Dashboards
Custom Power BI dashboards that turn raw data into clear, actionable views for executives, managers, and operational teams.
Inquire
Power BI dashboards, business intelligence, and decision-support analytics for small and mid-sized organizations ready to move beyond basic reporting.
Eight focused service lines — engineered to help leaders understand what is happening in their business, why it is happening, and what to do about it next.
Custom Power BI dashboards that turn raw data into clear, actionable views for executives, managers, and operational teams.

Automate recurring reports, KPI tracking, and performance monitoring — save hours while improving consistency and accuracy.

Targeted analysis to surface trends, opportunities, risks, and the underlying drivers behind your performance.

Design meaningful metrics that align with business objectives — measure what matters, not what's easy to count.

Translate complex findings into clear narratives that move decisions forward for both technical and non-technical audiences.

Analyze workflows, bottlenecks, and performance trends to identify opportunities for efficiency and improved outcomes.

Analytical models and planning tools to evaluate scenarios, weigh trade-offs, and inform strategic decisions.

Bespoke analytical solutions built around your unique data sources, challenges, and business goals.
Lantern & Ledger Consulting helps small and mid-sized organizations move beyond basic reporting — through dashboards, reporting automation, KPI design, and decision-support analytics that translate raw numbers into clear understanding.
The name reflects the philosophy. The lantern represents illumination and discovery; the ledger represents the numbers themselves. Together: information turned into understanding.
“I started Lantern & Ledger because data should be understandable, accessible, and useful. The most valuable analytics aren’t the most complicated — they’re the ones that help people confidently take action. Every number represents a real process, customer, or decision, and that perspective shapes every project.”
The goal is to turn data into information, and information into insight.
Representative engagements drawn from analytics, BI, and operations work. Many projects involve confidential business data; what’s shared here emphasizes methodology and outcome rather than client specifics.
View public work on GitHubConsolidated multi-warehouse KPIs — on-time delivery, dock-to-stock, and labor productivity — into a single Power BI executive view.
Real-time exception dashboard surfacing late shipments, inventory imbalances, and carrier underperformance with drill-through detail.
Seasonal forecasting model with scenario comparison, blending historical demand with promotional and operational adjustments.
End-to-end KPI framework aligning team-level metrics with executive scorecards — measuring what actually moves performance.
Replaced a manual workbook process with an automated SQL + Power BI pipeline delivering weekly narratives and exception summaries.
Analytical deep-dive identifying inefficiencies in inter-facility flow, with quantified opportunities for lane consolidation.
Have a similar challenge? Engagements are scoped around the specific outcome you’re trying to reach.
Discuss a projectWhat prospective clients ask most often before starting an engagement. If your question isn’t here, reach out directly — every conversation begins with listening.
Initial conversations are no-cost and focused on understanding your data and decisions — not selling services.
Start a conversationLantern & Ledger Consulting provides business intelligence, dashboard development, reporting automation, KPI design, data analysis, forecasting support, and data storytelling services.
Without data, you’re just another person with an opinion.
Share a little about your organization and what you’re trying to understand. Rowan will reach out within one business day to set up an initial conversation — no cost, no obligation.